Monitoring/Debugging Matlab® Code
When executing the project on the controller and while you are connected and logged on to the controller, the Matlab® viewers can be switched to debug mode.In a similar way as for graphical IEC 61131-3 code worksheets, you can:
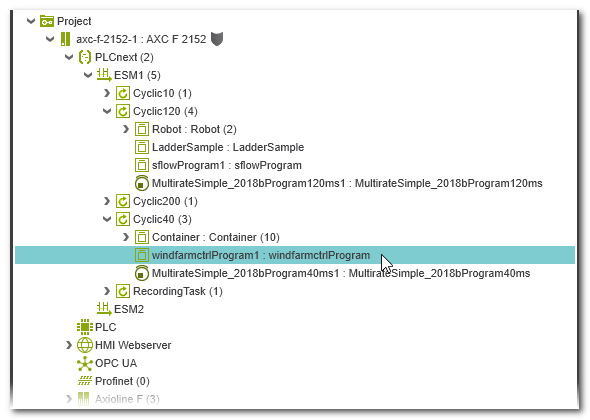
- Select a program instance to monitor the code execution in debug mode.
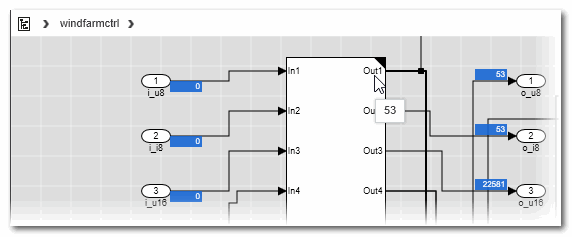
As for IEC 61131-3 code worksheets, you can call a Matlab® instance by double-clicking the respective instance node in the PLANT or by selecting the context menu item 'Go to Instance Editor' in the Matlab® viewer. - While a Simulink® worksheet shows online values, you can display online value tooltips by hovering over an object with a test point (available as a hidden/internal port on the input or output of a block).
- In online Stateflow charts, active states are shown with a blue frame.
Online values are displayed in the Symbol view on the right side. - In online Truth Tables, online values are displayed in the Symbol view on the right side.
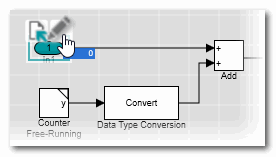
- Force and overwrite IN and OUT ports. In the Simulink® viewer, you can force/overwrite ports directly at the port symbol. In Stateflow charts and Truth Tables, forcing and overwriting has to be done in the Symbol view on the right side.
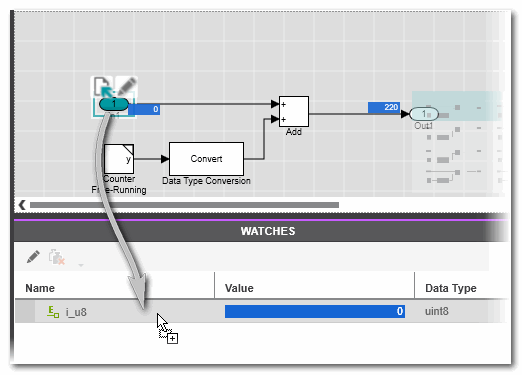
- Add IN and OUT ports to the WATCHES window and/or to the LOGIC ANALYZER for monitoring purposes (by drag & drop).In the Stateflow chart viewer and in Truth Tables, online values have to be dragged from the Symbol view on the right side. Alternatively, the context menu of a variable can be used.
 Example: adding a Matlab® port to the WATCHES list from the Simulink® viewer
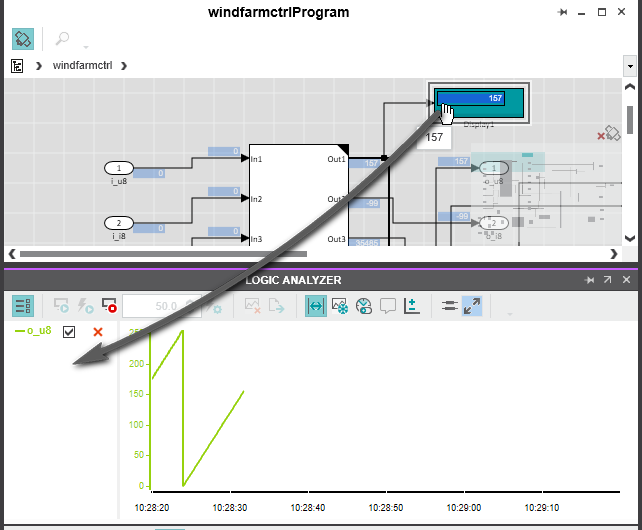
Example: adding a Matlab® port to the LOGIC ANALYZER from the Simulink® viewer
Example: adding a Matlab® port to the WATCHES list from the Simulink® viewer
Example: adding a Matlab® port to the LOGIC ANALYZER from the Simulink® viewer
Refer to the help chapter "Controller Commissioning: From Compiling to Debugging" for details.