Extended Debugging: Functions, Methods and SFC Actions/Transitions
The Cockpit provides several toolbar buttons for enabling extended debug features. When enabled, additional code is generated and executed which then supports these debug operations. Even forcing/overwriting and the use of breakpoints is possible while the option is activated.
To debug methods, inline transitions, and actions, activate the 'Debug Functions' toolbar button:
Activating the button opens the 'Debug Code Settings' dialog. In the dialog, select the items you want to debug. (In order to keep processor load and memory consumption as low as possible, mark only those items (POUs) that are really required.)
| Note
The Debug Function mode requires additional code that must be generated by the compiler. Therefore,
|
|
WARNING
|
Unintended machine operation
|
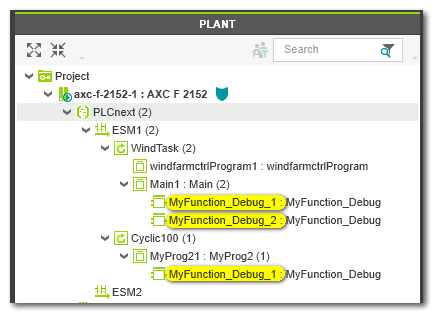
When switching to the extended debug mode 'Debug Functions', the PLANT shows the following: Each call of a function is visible as separate instance node (named 'functionname_Debug') under the respective program or FB instance node.
Example:
| Note
Deactivate this extended debugging feature for normal operation, i.e., after debugging. |