WATCHES: Monitoring/Debugging the Application
| Note
This topic only applies to the standard (non-safety-related) controller. The steps for the Safety PLC are described in the help chapter "Safety PLC Commissioning: From Compiling to Debugging ×‣ Connecting vs. Monitoring Mode vs. Debug Mode ×‣ Controlling the Safety Application from the Safety Cockpit ×‣ Safety PLC Diagnostics out of the Safety Cockpit ×‣ Monitoring/Debugging the Safety PLC ×‣ Monitoring Mode: Displaying Online Values ×‣ Debugging Safety-Related Code: Forcing/Overwriting ×‣ WATCHES: Monitoring/Debugging the Safety-Related Application ×‣ Safety PLC Simulation ×". |
 | The WATCHES window can be used to collect variables to monitor their online values while the application is executed. This makes it unnecessary to open the individual code worksheets containing the variables to be monitored. Within the WATCHES window, forcing/overwriting of variables is possible.The WATCHES window is located in the Cross Function Area at the lower screen border. You can hide/show the window by clicking the WATCHES window button on the Cross Function Area toolbar. |
| Note
The update rate of online values depends on the set 'Polling interval' which is specified in the 'Options' dialog. The higher the interval value, the less data is transferred in the background between PLCnext Engineer and the controller, i.e., the longer the time until the next online value update in online worksheets, the WATCHES window, and the LOGIC ANALYZER. Therefore set the interval value as short as the Internet connection allows. See topic "TCP Communication Connection". |
Adding variables/Ports to WATCHES
Variables/Ports can be added to the WATCHES window by dragging them from- code worksheets or
- variables tables or
- the Data List of the controller runtime/controller
In SFC, steps and actions can be added to the WATCHES window.
| Note
Exception: from textual code worksheets, variables can only be added via the context menu or by dragging the entirely selected variable using the mouse. |
A variable/Port can only be added once to the WATCHES window. Newly added variables/Ports are always added at the end of the watch list.
The WATCHES window content is saved locally on your computer when saving the project. This means that the watch list is restored in the WATCHES window when re-opening a project.
Special cases
-
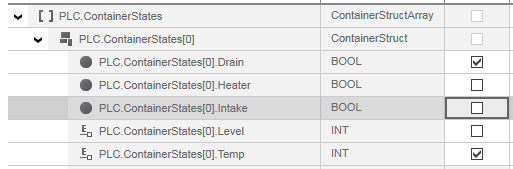
User defined data types: On insertion of a user-defined data type, such as a STRUCT or ARRAY variable, the 'Add to WATCHES' dialog box appears where you can select the contained STRUCT/ARRAY members to be subscribed. Multiselection is possible if the selected variables do not have an ancestor/descendant relation (e.g., array and contained members).
Using the following toolbar icons you can expand and collapse contained structures/arrays: You can filter the selection dialog box.

 Example for selecting the members of a STRUCT data type for insertion
- SFC code: Steps and actions can be added to the WATCHES window.
- Ports can also be added from local variables tables (only programs) and from the PLCnext Port List. Their online values are shown in the WATCHES window in the same representation like IEC variables.


Content of the WATCHES window
The tabular WATCHES window shows the following information for each inserted variable:
- Variable/Port name: in case of a function/function block input/output, the name is composed of the function/FB instance name and the input/output name separated by a dot. Example: P_GEN_1.Q.
- Value: current online value of the element. This is the value of the element between two task execution cycles.
Forced values are shown in the following color gradients:
The display format of online values can be adapted. Refer to the section "Setting the display mode" for details.
Value forced to TRUE 
Value forced to FALSE - Data type of the variable.
- Instance: location where the variable is used, including the unique instance path.
Also observe the section "Setting the display mode" below.
WATCHES window context menu
Right-clicking a variable in the WATCHES window opens the context menu providing the following commands.
| Command | Shortcut | Description |
|---|---|---|
| Overwrite/Force | <Ctrl> + <Alt> + <2> | Overwrites or forces the selected element with a defined value. Forced values are shown with a color gradient (see list above).For detailed information on overwriting using the WATCHES window, see the topic "Debugging Code: Forcing/Overwriting". |
| Unforce | <Ctrl> + <Alt> + <3> | Resets the forced value to the actual value. Only active if the variable is forced. |
| Select All | <Ctrl> + <A> | Selects all elements in the WATCHES window. |
| Collapse | - | Collapses an expanded user-defined element, such as STRUCT or ARRAY. |
| Delete | <Del> | Removes the selected element from the WATCHES window.Multiselection is possible, by using the 'Select All' context menu item or by selecting individual variables while holding the <Ctrl> key down while left-clicking. |
| Display | - | Sets the display mode of the selected variable. See section below. For particular data types, the display mode cannot be switched (inactive menu item). Which modes are available depends on the data type.When executing the command on the root node of an array data type, all array members are switched to the same display mode. However, you can switch the display of individual array members. |
Setting the display mode
Some data types provide different possibilities of displaying their online values. To adapt the display, right-click the variable and open the 'Display' submenu in the context menu. If the menu item is inactive, only the currently active mode is possible for the selected variable.
| Note
Independently of the WATCHES display mode, the displayed format of REAL, LREAL and Boolean variables in debug mode can be set via the 'Extras > Options' menu item. In the 'Options' dialog, select the category 'Options | Online Values' and specify the number of visible digits. See section "Setting the online format of REAL and LREAL variables" for details. |
| Display mode | available for | Meaning |
|---|---|---|
| Dual | Boolean variables | Displays the value TRUE or FALSE with different background colors. |
| Labels | Boolean variables with defined pragma | Displays the pragma label defined for the variable values TRUE/FALSE. |
| Dual Labels | Boolean variables with defined pragma | Combines the displays of the pragma label defined for the variable values TRUE/FALSE with the background colors for TRUE or FALSE. |
| LED | ANY_BIT variables including BOOL | Displays an LED symbol instead of value or label: FALSE =  and TRUE = and TRUE =  In case of ANY_BIT variables > BOOL, one LED is shown per digit.
Example for a BYTE variable: 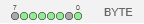 |
| Hexadecimal | ANY_BIT variables except BOOL | Displays the ANY_BIT variable as hexadecimal value with the prefix 16#. |
| Decimal | ANY_BIT variables except BOOL and ANY_REAL | Displays the ANY_BIT variable as decimal value. |
| Octal | ANY_BIT variables except BOOL | Displays the ANY_BIT variable as octal value with the prefix 8# |
| Binary | ANY_BIT variables except BOOL | Displays the ANY_BIT variable as bit string with the prefix 2#. Example for a BYTE variable:  |
| Exponential | ANY_REAL variables | Displays the value in exponential representation. Example for an LREAL variable:  |
The set display mode is stored in the project with the WATCHES list.