Debug mode: Monitoring the Application Execution
| Note
This topic only applies to the standard (non-safety-related) controller. The steps for the Safety PLC are described in the help chapter "Safety PLC Commissioning: From Compiling to Debugging ×‣ Connecting vs. Monitoring Mode vs. Debug Mode ×‣ Controlling the Safety Application from the Safety Cockpit ×‣ Safety PLC Diagnostics out of the Safety Cockpit ×‣ Monitoring/Debugging the Safety PLC ×‣ Monitoring Mode: Displaying Online Values ×‣ Debugging Safety-Related Code: Forcing/Overwriting ×‣ WATCHES: Monitoring/Debugging the Safety-Related Application ×‣ Safety PLC Simulation ×". |
- General information on debugging
- Starting/exiting the debug mode
- Selecting a program/FB instance to display online values
- Worksheets in debug mode
- Extended debugging: execution values/execution indication vs. "normal" online values
- Extended debugging of user-defined functions, methods, and SFC actions/transitions
- Setting the online format of REAL and LREAL variables
| Note
The update rate of online values depends on the set 'Polling interval' which is specified in the 'Options' dialog. The higher the interval value, the less data is transferred in the background between PLCnext Engineer and the controller, i.e., the longer the time until the next online value update in online worksheets, the WATCHES window, and the LOGIC ANALYZER. Therefore set the interval value as short as the Internet connection allows. See topic "TCP Communication Connection". |
General information on debugging
The project execution on the controller can be monitored while PLCnext Engineer is in debug mode, i.e., if PLCnext Engineer is attached to the application process running on the controller. In debug mode, online values are read cyclically from the controller and displayed in the editors.
The debug mode supports you during the function test: it enables checking the behavior of the input and output devices, thus detecting programming errors and ensuring that the project is executed correctly and as intended. In debug mode, the project cannot be edited.
In debug mode, the controller icon in the PLANT (as well as in the ONLINE STATE window) indicates the controller status. Examples:
 = state On, no project is loaded
 = Running
The status indication icons look different (not filled) when debug mode is off:  ,
, 
In debug mode, the editor group tabs are marked by a triangle in the upper left corner.

If the connection to the controller is interrupted, debug mode is automatically terminated.
Starting/exiting the debug mode
Automatic activation: the debug mode is automatically activated after executing one of the 'Write and Start' commands.
Manual activation: if you want to activate the debug mode without writing a new project image to the controller, this is done in two steps.
In the 'Cockpit' editor of the controller:- Select the 'Connect/Disconnect' command:
 This command is also available Not yet logged on to the controller? If the controller involved implements a secure device concept, and if you are not yet logged on to the controller (black shield symbol beside the controller icon in the PLANT), the logon mask appears. Enter the user name of the desired and suitable role as well as the relating password and press <Enter> to log on. (Make sure that the user role you are entering allows debugging the project.)
- in the context menu of the controller in the PLANT,
- in the context menu of the controller in the ONLINE STATE window.
If an authentication error occurred during connection establishment, a dialog appears where you can instruct PLCnext Engineer to nevertheless establish the ("unsecured") connection.While you are logged on to the controller, this is indicated by a green shield symbol beside the controller icon in the PLANT. When hovering the mouse on the controller icon, a tooltip appears showing logon information. Refer to the topic "Network Security" for details.If you have accepted an "unsecured" connection, the following shield symbol is displayed:
  The
controller icon in the PLANT indicates the controller status (see icons above).
The
controller icon in the PLANT indicates the controller status (see icons above). - Select the
'Debug On/Off' command:

While the debug mode is active, you can use the Fast Edit Mode as a one-click command for switching between debugging and editing. Refer to the topic "Fast Edit mode: One-click switching between debugging and editing".
 | Exiting
debug mode
: to terminate the
debug mode and switch back to programming mode (offline mode), detach PLCnext Engineer from the running application process by selecting the
'Debug On/Off' command again.After detaching, PLCnext Engineer is still connected to the controller but no online values or debug commands are transmitted any longer. The status indication icons then look different (see section "General Information" above).To reattach to the application process, select the 'Debug On/Off' command again. |
 | When selecting the command 'Connect/Disconnect' from the controller context menu in the PLANT or on the 'Cockpit' toolbar while debug mode is active, PLCnext Engineer detaches from the running application process (programming mode becomes active) and then disconnects from the controller. |
| Further Info
Refer to topic "Connecting vs. Attaching" for detailed information. |
Selecting a program/FB instance to display online values
To display online values for program and function block POU types, an instance must be selected. An opened program or function block worksheet does not automatically switch to debug mode when switching PLCnext Engineer to debug mode. Instead, this worksheet remains offline, because PLCnext Engineer needs to know the instance for which online values are to be read. This applies to both code worksheets and the local variable tables.
To select an instance, right-click in the POU editor, select 'Go To Instance Editor' from the context menu and click the desired instance. Note that this is only possible in code worksheets but not in variable tables. After selecting an instance, two tabs of the editor are visible: offline as POU type (blue color marking) and online as instance (green color marking). Refer to the following example.
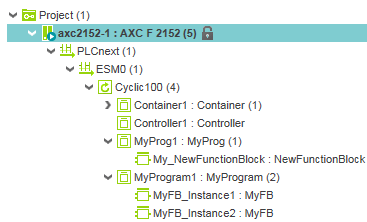
Alternatively, you can open a POU instance from the PLANT in debug mode by double-clicking the related instance icon. The instance icons are contained under the 'PLCnext' node. Refer to the example below.
 Example
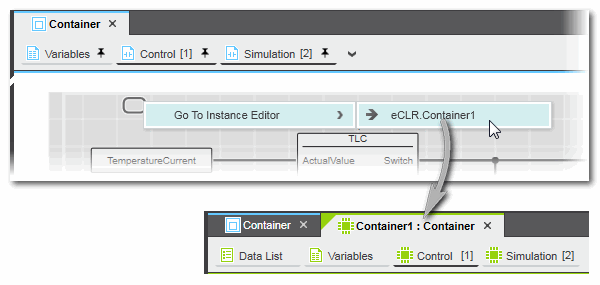
Worksheets in debug mode
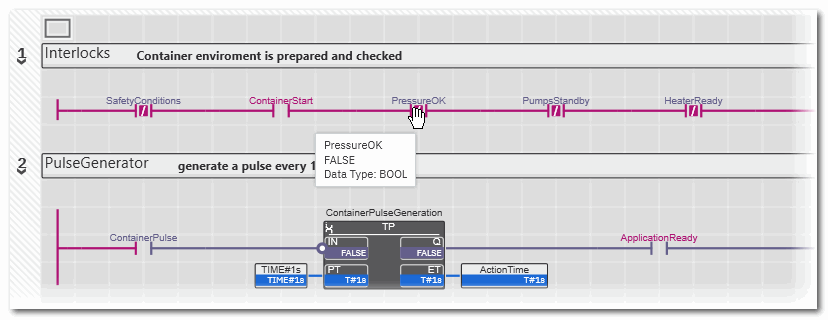
The online values are shown in all online worksheets and tables in different colors according to the variable state read from the controller. Additionally, the tooltip shown when hovering the mouse pointer over an object or variable displays the current value.
Graphical worksheets: in debug mode, graphical objects and connection lines are shown colored according to the variable state read from the controller. Connecting lines are animated. In online SFC worksheets, active steps and their actions are displayed green, inactive steps are shown brown.
| Note
In order to debug user-defined functions/methods and/or to show the execution value (actual value at the code position) and execution indication in online worksheets, you have to select the required extended debug option in the controller Cockpit. Refer to the sections "Extended debugging: execution values/execution indication vs. "normal" online values" and "Extended debugging of user-defined functions, methods, and SFC actions/transitions" for details. |
| Note
Functions only show online values if the respective formal parameters are connected to objects which also show online values. Online values are not visible if a function formal parameter is connected to another function. |
| Note
Boolean online values can be displayed in textual form or as "LED":  = FALSE, = FALSE,  = TRUE. See section "Setting the online format of REAL and LREAL variables" below. = TRUE. See section "Setting the online format of REAL and LREAL variables" below. |
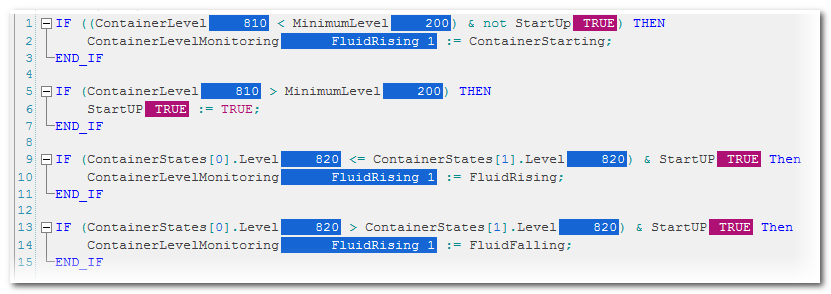
Textual worksheets: in debug mode, the online value of a code object is shown according to its state read from the controller.
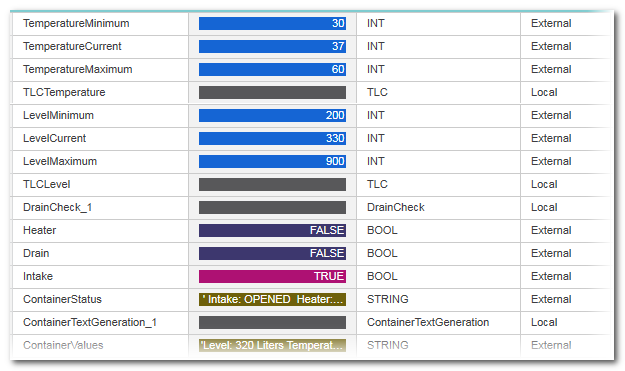
Variables tables and Data Lists: in debug mode, the online value of a code object is shown in a separate 'Value' column. The context menu provides commands to add a variable to the WATCHES window and to force/overwrite it. Online values of ports (only available for PLCnext Technology controllers) in local variables tables and in the PLCnext Port List are shown in the same representation like IEC variables.
| Further Info
In debug mode, you have the following options:
|
Setting the online format of REAL and LREAL variables
The displayed format of REAL, LREAL, and BOOLean variables in debug mode can be set via the 'Options' dialog.
- Select the 'Extras > Options' menu item.
- In the 'Options' dialog, select the category 'Online | Online Values'.
- Specify the desired representation for the various data types.
| Note
Modified settings are applied to newly opened online worksheet instances. The representation in already open online worksheets is possibly not switched. |