Chart
The chart object enables trending of historical and real-time controller data. It allows you to visualize and monitor the development of data values recorded with a TSDB (Time Series Database) Data Logger session in a trending chart. The time series database stores the data values (series data) collected from the PLCnext IN or OUT ports added to the Data Logger session.
To enable the use of a chart object in your HMI application, you first have to configure a valid Data Logger session of type TSDB. The TSDB session is used as the source of the trend data visualized in the chart. It defines which variables are sampled. Once you have configured the session, you can associate it to the chart object on the HMI page.
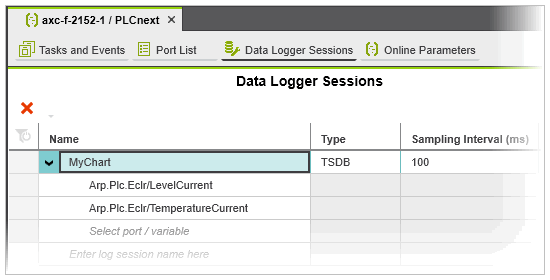
Step 1: Configuring a Data Logger session
- Open the 'Data Logger Sessions' editor (editor of the 'PLCnext' node) and create a session of type TSDB.
- Add the ports to be recorded in the session by selecting the ports in the 'Name' column. (Only ports that are actually used (i.e., instantiated) in the project can be added to the session.)
Note
For details on the configuration of a Data Logger session, see the section "How to configure the Data Logger in PLCnext Engineer" in the "Data Logger" topic.
Step 2: Configuring the chart object
- Drag and drop the chart object from the COMPONENTS area into your HMI page.
- In the object's properties window, configure the common properties of the object such as the object ID, the style of the object, etc.
- In the 'Chart' group, select the Data Logger session to be used as source for the trend data from the 'Data logger session' list box. (The list box provides all TSDB sessions configured in the 'Data Logger Sessions' editor.)
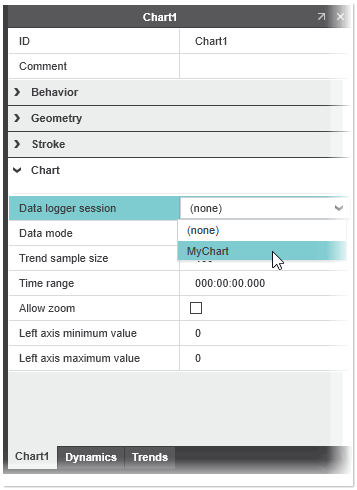
- Define the chart properties under the 'Chart' group.
Property Description 'Data Mode' Defines the amount of data to be displayed on the chart. Choose one of the following options: - 'Downsample' - downsamples the data points to be displayed using a specific algorithm. Downsampling allows you to reduce the sampling rate of the data points.
- 'Raw' - retrieves the raw data points from the server and displays them on the chart.
'Trend Sample Size' Indicates the number of data points to display per trend line on the chart. 'Time Range' Use the property to set the time range of the data points available in the Data Logger session to be shown (from current to entered amount of time). A value of zero shows all available data points. 'Allow zoom' If checked, adjustable sliders are displayed beneath the plot area which can be used to zoom in/out of the time range. 'Left axis minimum value' / 'Left axis maximum value' Use the values to define the range of the Y axis (lowest and highest value that can be shown). If both values are 0, then the Y axis will be automatically scaled to match the data. - Choose which variable from the Data Logger session should be plotted on the chart and the line color. To do this, open the 'Trends' tab and activate the checkbox for the variable to be included in the chart (the list provides all variables that are recorded in the selected data logger session). To change the line color of a variable, click on the 'Color' property and select the desired color from the selection list.
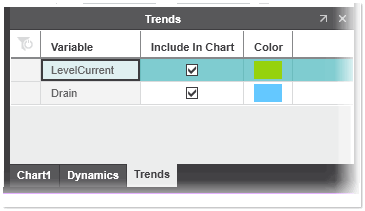
Chart symbol at runtime
When you use the chart object in runtime, you can:
- Zoom in, zoom out, and reset the X and Y axis with the mouse or gestures on multi touch displays.
- Show the graph values in a tooltip when placing the mouse over a graph.
- Show/hide a particular graph by clicking on the variables name in the axis labeling on the left of the diagram.