Debug mode: Monitoring the Application Execution
| Note
This topic only applies to the standard (non-safety-related) controller. The steps for the Safety PLC are described in the help chapter "Safety PLC Commissioning: From Compiling to Debugging ×‣ Connecting vs. Monitoring Mode vs. Debug Mode ×‣ Safety Cockpit: Controlling the Safety Application ×‣ Safety PLC Diagnostics out of the Safety Cockpit ×‣ Monitoring/Debugging the Safety PLC ×‣ Monitoring Mode: Displaying Online Values ×‣ Debugging Safety-Related Code: Forcing/Overwriting ×‣ WATCHES: Monitoring/Debugging the Safety-Related Application ×‣ Safety PLC Simulation ×". |
| Note
The update rate of online values depends on the set 'Polling interval' which is specified in the 'Options' dialog. The higher the interval value, the less data is transferred in the background between PLCnext Engineer and the controller, i.e., the longer the time until the next online value update in online worksheets, the WATCHES window, and the LOGIC ANALYZER. Therefore set the interval value as short as the Internet connection allows. See topic "TCP Communication Connection". |
General information on debugging
The project execution on the controller can be monitored while PLCnext Engineer is in debug mode, i.e., if PLCnext Engineer is attached to the application process running on the controller. In debug mode, online values are read cyclically from the controller and displayed in the editors.
The debug mode supports you during the function test: it enables checking the behavior of the input and output devices, thus detecting programming errors and ensuring that the project is executed correctly and as intended. In debug mode, the project cannot be edited.
In debug mode, the controller icon in the PLANT (as well as in the ONLINE STATE window) indicates the controller status. Examples:
 = state On, no project is loaded
 = Running
The status indication icons look different (not filled) when debug mode is off:  ,
, 
In debug mode, the editor group tabs are marked by a triangle in the upper left corner.

If the connection to the controller is interrupted, debug mode is automatically terminated.
Starting/exiting the debug mode
Automatic activation: the debug mode is automatically activated after executing one of the 'Write and Start' commands.
Manual activation: if you want to activate the debug mode without writing a new project image to the controller, this is done in two steps.
In the 'Cockpit' editor of the controller:- Select the 'Connect/Disconnect' command in the Cockpit toolbar or from the context menu of the controller in the PLANT or in the ONLINE STATE window:
 The
controller icon in the PLANT indicates the controller status (see icons above).
The
controller icon in the PLANT indicates the controller status (see icons above). - Select the
'Debug On/Off' command:

 Not yet logged on to the controller?

| Note
When activating the debug mode, a comparison of the project names and the CRCs of the local project loaded in PLCnext Engineer and the project executed on the controller is performed. If the project names and/or CRCs differ, a corresponding message appears informing you about the project differences. You can either abort the process or continue. If you continue, wrong online values may be displayed. If you cancel the dialog, the process is aborted and a corresponding warning is shown in the 'Online Log' in the 'MESSAGES' window. Behavior with breakpoints set If breakpoints are set (no matter whether the breakpoint is in enabled or disabled state) or the controller is in halt mode and the CRCs differ, debug mode cannot be enabled. A corresponding message appears where you can abort the process. The 'Online Log' shows a corresponding warning after aborting. If you have entered the debug mode with different CRCs, the breakpoint will be disabled/in disabled state. When you set a breakpoint, the breakpoint will enter the disabled state. |
| Note
While the debug mode is active, you can use the Fast Edit Mode as a one-click command for switching between debugging and editing. |
 | Exiting
debug mode: to terminate the
debug mode and switch back to programming mode (offline mode), detach PLCnext Engineer from the running application process by selecting the
'Debug On/Off' command again.After detaching, PLCnext Engineer is still connected to the controller but no online values or debug commands are transmitted any longer. The status indication icons then look different (see section "General Information" above).To reattach to the application process, select the 'Debug On/Off' command again. |
 | When selecting the command 'Connect/Disconnect' from the controller context menu in the PLANT or on the 'Cockpit' toolbar while debug mode is active, PLCnext Engineer detaches from the running application process (programming mode becomes active) and then disconnects from the controller. |
| Further Info
Refer to topic "Connecting vs. Attaching" for detailed information. |
Selecting a program/FB instance to display online values
To display online values for program and function block POU types, an instance must be selected. An opened program or function block worksheet does not automatically switch to debug mode when switching PLCnext Engineer to debug mode. Instead, this worksheet remains offline, because PLCnext Engineer needs to know the instance for which online values are to be read. This applies to both code worksheets and the local variable tables.
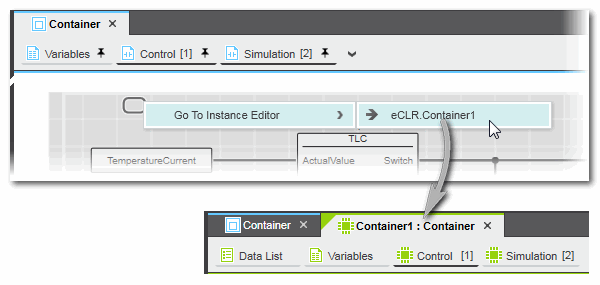
To select an instance, right-click in the POU editor, select 'Go To Instance Editor' from the context menu and click the desired instance. Note that this is only possible in code worksheets but not in variable tables. After selecting an instance, two tabs of the editor are visible: offline as POU type (blue color marking) and online as instance (green color marking). Refer to the following example.
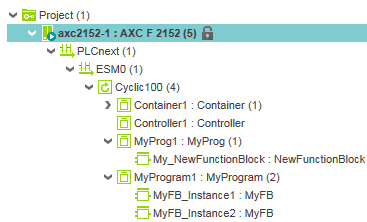
Alternatively, you can open a POU instance from the PLANT in debug mode by double-clicking the related instance icon. The instance icons are contained under the 'PLCnext' node. Refer to the example below.
Worksheets in debug mode
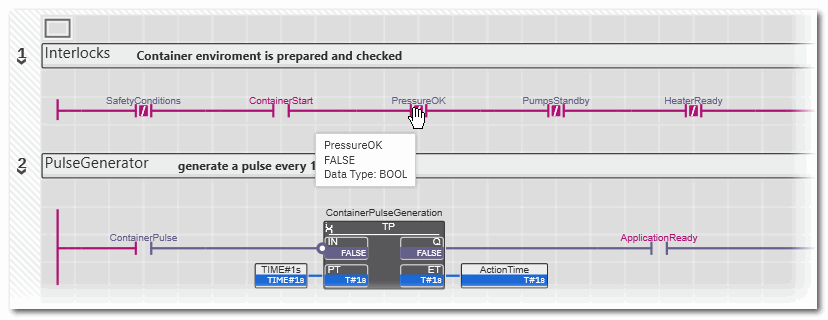
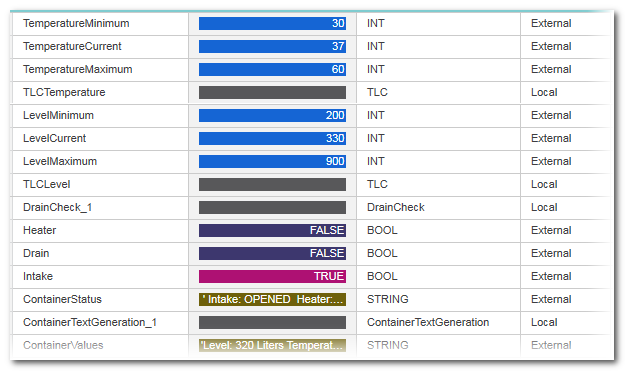
The online values are shown in all online worksheets and tables in different colors according to the variable state read from the controller. Additionally, the tooltip shown when hovering the mouse pointer over an object or variable displays the current value.
| Worksheet type | Representation in debug mode |
|---|---|
| Graphical | Objects and connection lines are shown colored according to the variable state read from the controller. Connecting lines are animated. In online SFC worksheets, active steps and their actions are displayed green, inactive steps are shown brown.The representation of online values can be changed by choosing different value formats. For example, Boolean online values can be displayed in textual form or as "LED":  = FALSE, = FALSE,  = TRUE. = TRUE. See section "Setting the online representation (format) of variables" below.Functions only show online values if the respective formal parameters are connected to objects which also show online values. Online values are not visible if a function formal parameter is connected to another function. |
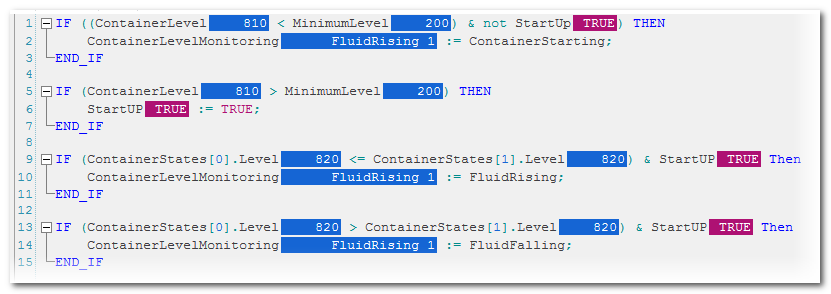
| Textual | The online value of a code object is shown according to its state read from the controller. |
| Variables grids, Data/Port Lists | The online value of a code object is shown in a separate 'Value' column. The context menu provides commands to add a variable to the WATCHES window and to force/overwrite it. Online values of ports in local variables tables and in the GDS Port List are shown in the same representation like IEC variables. |
| Further Info
In debug mode, you have the following options:
|
Setting the online representation (format) of variables
Setting the default display format
The default value format for the display of online variables in debug mode can be set via the 'Options' dialog.
- Select the 'Extras > Options' menu item.
- In the 'Options' dialog, select the category 'Online | Online Values'.
- Specify the desired representation for the various data types.
| Note
Modified settings are applied to newly opened online worksheet instances. The representation in already open online worksheets is possibly not switched. |
Individual setting of the display format for a variable
- Double-click the value of the variable in the worksheet or variables table in debug mode. Alternatively, right-click the variable and select 'Overwrite / Force' from the context menu or left-click the table line and press the shortcut <Ctrl> + <Alt> + <2>.
- In the appearing control, click the drop-down arrow on the right and select the desired display format.
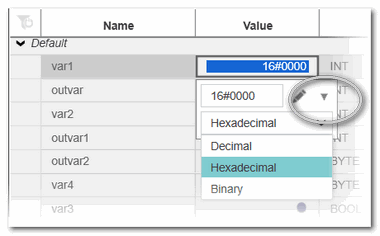 Depending on the data type of the variable, the following display formats can be used:
Display mode available for Meaning Textual (True / False) Boolean variables Displays the value TRUE or FALSE with different background colors. Label Boolean variables with defined pragma Displays the pragma label defined for the variable values TRUE/FALSE. Label Highlighted Boolean variables with defined pragma Combines the displays of the pragma label defined for the variable values TRUE/FALSE with the background colors for TRUE or FALSE. LED ANY_BIT variables including BOOL Displays an LED symbol instead of value or label:
FALSE = and TRUE =
  In case of ANY_BIT variables (> BOOL and < DWORD), one LED is shown per bit (not supported for ANY_BIT variables greater than WORD).
Example for a BYTE variable: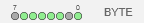
Hexadecimal ANY_BIT variables except BOOL Displays the ANY_BIT variable as hexadecimal value with the prefix 16#. Decimal ANY_BIT variables except BOOL and ANY_REAL Displays the ANY_BIT variable as decimal value. Binary ANY_BIT variables except BOOL Displays the ANY_BIT variable as bit string with the prefix 2#.
Example for a BYTE variable:
Exponential ANY_REAL variables Displays the value in exponential representation.
Example for an LREAL variable:
| Note
You can remove all display formats individually set for the online variables in the project via the 'Extras > Options' dialog. In the category 'Online | Online Values', press the 'Reset' button under the 'Reset all formatters of current project' group to reset the format. |