Diagnostics of the EtherCAT Master/Slaves
This topic contains the following sections:
- Preparations & Preconditions for using the 'Online Functions'
- Functions of the EtherCAT Online Functions editor
- Structure of the EtherCAT Online Functions editor
- EtherCAT Online Bus Scan
- What do you want to do?
This chapter provides an overview of the basic diagnostic options for an EtherCAT network. Hardware and software diagnostics are taken into account.
On the PLCnext Engineer side, the so-called 'Online Functions' are available for diagnostics. The editor is available on the EtherCAT master node in the PLANT. After an online bus scan of the EtherCAT network (automatic or manual), the online functions can be used to determine the current state of the EtherCAT network in a simple way. Information about the components involved as well as about the communication between the nodes is retrieved from the network. You can mark the master or one of the detected slaves in a tree view and then have access to several editor tabs with various diagnostic information and commissioning options, from the display of frame counters to direct access to slave parameters and ESC registers. Thus, the available editors allow a detailed diagnosis.
The help chapter is divided into the following subchapters:- Topology diagnosis
- Hardware diagnostics (on the device and via 'Online Functions')
- Software diagnostics ('Online Functions')
Preparations & Preconditions for using the 'Online Functions'
To use the EtherCAT online functions, it is not required that the PLANT tree represents (models) the EtherCAT topology in PLCnext Engineer. This means, the structure of the PLANT in PLCnext Engineer may differ from the actually connected EtherCAT network.
However, the controller must be connected to PLCnext Engineer.
 Preparations: Connect to the controller

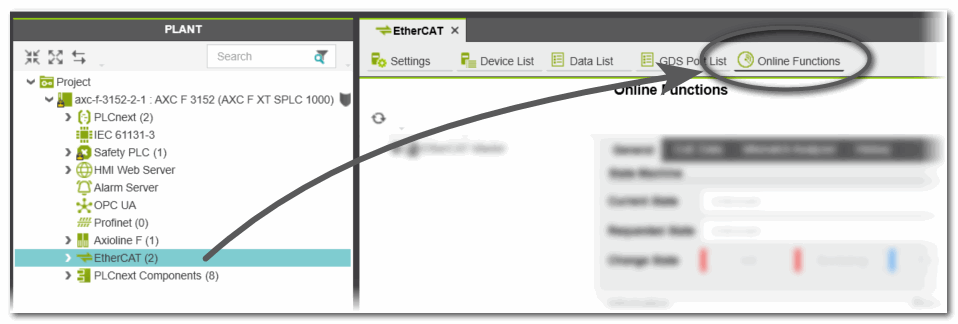
To open the editor, double-click the 'EtherCAT' node in the PLANT and then click 'Online Functions' in the editors area.
If the controller is connected as described above, the editor automatically opens the online channel to the EtherCAT master system.
Example: Opening the EtherCAT 'Online Functions' editor
Functions of the EtherCAT Online Functions editor
- Perform an online EtherCAT bus scan (see section below).
- Displays basic information on the EtherCAT master and slave stations connected to the controller (which in turn is connected to the PC on which PLCnext Engineer runs) as well as on their topology.
- Displays information on the ongoing EtherCAT communication.
- Displays and allows to change the state of the EtherCAT master and each slave.
- Provides read and (if allowed by the node) write access to the CoE data of each node.
Structure of the EtherCAT Online Functions editor
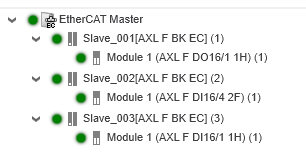
On the left, the found EtherCAT network nodes are listed. An LED-like icon symbolizes the current state of the node.
The colors of this icon corresponds to the color of the state icon displayed on the right (in the editor section 'State Machine'): Red = Init or Bootstrap, blue = Pre-Op, yellow = Safe-Op and green = Op.
The information displayed in the tab on the right and the operations you perform there relate to the EtherCAT node selected in the tree.
On the right side, several editor tabs are visible, depending on the selected node (EtherCAT master or slave)
EtherCAT Online Bus Scan
When opening the online functions while the controller is connected and accessible in the network, PLCnext Engineer automatically an EtherCAT bus scan and displays the detected devices in the bus structure tree.
Above this tree, a refresh icon is available with which you can update the tree view by performing a new network scan.

What do you want to do?
 Perform a topology diagnosis using the 'Mismatch Analyzer'
Perform hardware diagnostics using status indication on the device and via 'Online Functions'
Perform software diagnostics using the 'Online Functions' editor