Debugging Code: Breakpoints
| Note
This topic only applies to the standard (non-safety-related) controller. The steps for the Safety PLC are described in the help chapter "Safety PLC Commissioning: From Compiling to Debugging ×‣ Connecting vs. Monitoring Mode vs. Debug Mode ×‣ Safety Cockpit: Controlling the Safety Application ×‣ Diagnostics of Safety PLC out of the Safety Cockpit ×‣ Monitoring/Debugging the Safety PLC ×‣ Monitoring Mode: Displaying Online Values ×‣ Debugging Safety-Related Code: Forcing/Overwriting ×‣ WATCHES: Monitoring/Debugging the Safety-Related Application ×‣ Safety PLC Simulation ×". |
General information and preconditions
To supplement the function test, the code editors provide several debug features in
debug mode. For example, you can set breakpoints to halt the project execution at a specific code position. If a breakpoint is reached, the project execution halts at the position where the breakpoint is set and the controller state changes to the "Halted" state, as indicated at the controller PLANT node:

You can then examine the current values of variables or function/function block formal parameters.
Preconditions for using breakpoints:- Setting breakpoints is only possible while PLCnext Engineer is attached to the application process, i.e., switched to debug mode.
- Only if the use of breakpoints is activated in the Cockpit, the controller halts at a breakpoint.
For that purpose, the 'Activate/Deactivate all BP' icon must appear pressed. Otherwise, none of the defined breakpoints becomes activated, regardless of the commands you execute in online code worksheets or the BREAKPOINTS window.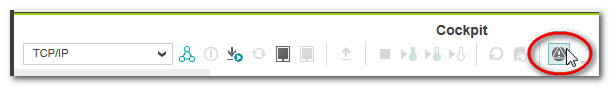
Note
While the use of breakpoints is not activated in the Cockpit, they are displayed with the icon in the code and BREAKPOINTS window.
 - Breakpoints cannot be set if:
- The source code has been modified after setting a breakpoint.
- The worksheet containing the object for which you want to set a breakpoint is deactivated (excluded from build process). See the topic "Excluding Code Worksheets from Build" for details.
Once a breakpoint is reached, the project execution can be continued by pressing the 'Continue' button in the CALL STACKS or BREAKPOINTS window (both are located in the Cross Function Area at the screen bottom) or by using one of the stepping functions which execute the project stepwise. The commands provided in the CALL STACKS and BREAKPOINTS window (continue and stepping) are described in section "Debugging with set breakpoints" below.
The management of breakpoints (setting, removing, toggling) can be done either in the online code worksheet or in the BREAKPOINTS window. The BREAKPOINTS window lists all breakpoints and provides a toolbar and context menu for toggling, disabling, and removing breakpoints as well as for jumping into a code worksheet, where a breakpoint is set (see table below).
If the CALL STACKS window or BREAKPOINTS window is not visible in the Cross Function Area at the lower screen border, you can show the window by clicking the corresponding button on the Cross Function Area toolbar:
 | BREAKPOINTS window |
 | CALL STACKS window |
| Note
Breakpoints are deactivated but not removed when detaching PLCnext Engineer from the application process (switching back from debug mode to programming mode) or exiting PLCnext Engineer. They have to be removed manually as described below. |
|
WARNING
|
Unintended machine operation
|
Commands for setting, toggling, and disabling breakpoints
Commands in code worksheets (in debug mode)
- Graphical code: commands are provided as in-place buttons and in the context menu if a variable or formal parameter of a function/function block is selected.
- Text editor: buttons are available on the editor toolbar if the cursor is set to a code line.
Note
In textual code, you can also left-click into the narrow column left of the beginning of the code line to set/toggle a breakpoint.
| Toolbar button | Command | Shortcut | Description |
|---|---|---|---|
 | Toggle Breakpoint | <Ctrl> + <Alt> + <F9> | Sets or removes a breakpoint at a selected code position or code line. If a breakpoint already exists at the selected position/code line, clicking the toolbar button removes the breakpoint. |
 | Enable/Disable Breakpoint | <Ctrl> + <Alt> + <F10> | Enables or disables an existing breakpoint. The breakpoint state (enabled or disabled) is shown with a corresponding symbol (see section "Breakpoint states and symbols" below). |
Commands in BREAKPOINTS window
Multiselection of entries is possible in the BREAKPOINTS window as usual. For example, hold the <Ctrl> key down while clicking the desired lines.
| Toolbar button | Context menu | Description |
|---|---|---|
 , ,  , , , ,  | Debug commands which are also available in the CALL STACKS window. Refer to section "CALL STACKS/BREAKPOINTS window: debugging with set breakpoints" for details. | |
| <Ctrl> + <Shift> + <F5> | Command: ContinueProgram execution is continued until the next set breakpoint is reached.The command is also available in the CALL STACKS window. |
| <F11> | Command: Step into the codeProgram execution is continued at the next line or object and is then halted at this code position. If a user FB call is reached, the POU code is opened in debug mode and stepped through. (This behavior applies to user FBs included in the current project as well as in referenced user libraries.)The command is also available in the CALL STACKS window. |
| <Ctrl> + <F11> | Command: Step over the codeProgram execution is continued at the next line or object and is then halted at this code position. If a user FB call is reached, the call is stepped over and the next line or object is marked.The command is also available in the CALL STACKS window. |
 | <Shift> + <F11> | Command: Step out of the codeThis command is relevant while stepping through the code of a user FB POU. This command exits the FB code and returns to the calling POU.The command is also available in the CALL STACKS window. |
 | Enable Breakpoint | Enables the breakpoint(s) selected in the window. The status switches to 'Active' in the window and the symbol in the code changes to  . . |
 | Enable All Breakpoints | Enables all breakpoints in the window. The status switches to 'Active' in the window and the symbol in the code changes to . |
| Disable Breakpoint | Disables the breakpoint(s) selected in the window. The status switches to 'Inactive' in the window and the symbol in the code changes to  . . |
 | Disable All Breakpoints | Disables all breakpoints in the window. The status switches to 'Inactive' in the window and the symbol in the code changes to . |
 | Remove Breakpoint | Removes the breakpoint(s) selected in the window. |
 | Remove All Breakpoints | Removes all breakpoints in the window. |
 | Go To Code | Opens the code worksheet where the breakpoint is set and marks the breakpoint. If the worksheet is not yet in debug mode, the corresponding instance is opened automatically. |
Breakpoint states and symbols
Various symbols attached to the element for which a breakpoint is set indicate the current state of the breakpoint as shown in the following example.
The status is also visible in the BREAKPOINTS window.
| Symbol in code | Symbol in BP window | Breakpoint status | Description |
|---|---|---|---|
|  | Enabled | Breakpoint is enabled. Enabled means the project execution halts every time the breakpoint is reached. |
|  | Disabled | Breakpoint is disabled. The breakpoint is still set in the code worksheet but it is ignored when the project execution reaches the breakpoint. |
 |  | Reached | Breakpoint is reached. The project execution is halted at the breakpoint position. The code position is displayed in the CALL STACKS window. The available stepping functions can be used to step through the code worksheet (see section "Debugging with set breakpoints" below). |
 |  | Inactive enabled | Breakpoint is enabled but cannot be reached because the use of breakpoints is not activated in the Cockpit. Activate the use of all breakpoints to use this breakpoint (see section "Preconditions" above). |
 |  | Inactive disabled | Breakpoint is disabled but the use of breakpoints is not activated in the Cockpit. (See section "Preconditions" above.) |
| - |  | Unbound | The breakpoint cannot be reached anymore or the communication connection between PLCnext Engineer and the controller is interrupted (offline) and no debug commands/online value can be transmitted. Unbound breakpoints are only displayed in the BREAKPOINTS window. In the code, no online display is possible while the controller is offline. |
Setting breakpoints
| Note
In order to debug user-defined functions/methods and/or to show the execution value (actual value at the code position) in online worksheets, you have to select the required extended debug option in the controller Cockpit. Refer to the sections "Extended debugging: execution values vs. "normal" online values" and "Extended debugging of user-defined functions, methods, and SFC actions/transitions" for details. |
To set a breakpoint for an element, proceed as follows:
- Double-click the controller node in the PLANT and open the 'Cockpit' editor. If the use of breakpoints is not enabled in the Cockpit, click the following icon and confirm the following safety message with 'Yes'. The icon appears pressed, if breakpoints are enabled and can be activated while debugging.

- Activate the debug mode by attaching PLCnext Engineer to the running application process.Select the POU instance where you want to set a breakpoint ('Go to Instance Editor' or double-click the instance icon in the PLANT) and open the desired worksheet.
-
In graphical code: left-click the name of the object where you want to set the breakpoint and click the 'Toggle Breakpoint' command button (editor toolbar or object's in-place buttons) to set a breakpoint at this position. Alternatively, select 'Toggle Breakpoint' from the context menu of the object or press the shortcut <Ctrl> + <Alt> + <F9>.
 In textual code: left-click into the narrow column left of the beginning of the code line, where you wish to set a breakpoint.
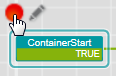
 Alternatively, left-click into the code line and click the 'Toggle Breakpoint' command button on the editor toolbar or press <Ctrl> + <Alt> + <F9>.The breakpoint is shown in the code worksheet with the following symbol:
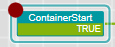
 The breakpoint is also listed in the BREAKPOINTS window. Here, commands are available to disable or remove it.
Note
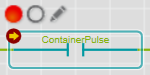
When setting the breakpoint while the project is running, the project execution may directly be halted at this position. - When the program execution is halted at a breakpoint, the following symbol is shown at the breakpoint position:In textual code, the respective variable appears with a yellow background:
 The respective code position is displayed in the CALL STACKS window (marked with
  ) and its state in the BREAKPOINTS window switches to 'Reached' (
 ). Now you can step through the code by using the commands provided in the CALL STACKS or BREAKPOINTS window or continue the execution until the next breakpoint is reached. See following section "CALL STACKS/BREAKPOINTS window".
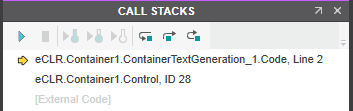
CALL STACKS/BREAKPOINTS window: debugging with set breakpoints
When the project execution is halted at a set breakpoint (indicated by the symbol at the breakpoint position), the code position
is marked
- in the CALL STACKS window with a yellow arrow
- in the BREAKPOINTS window with the arrow symbol
Both the CALL STACKS and the BREAKPOINTS window provide commands to continue the execution until the next breakpoint is reached or to use one of three available stepping functions.
Using a stepping function, the project can be executed stepwise to perform a controlled execution of the application. For that purpose, the respective step button in the CALL STACKS/BREAKPOINTS window or the related keyboard shortcut must be pressed repeatedly.
When stepping, the current step position is indicated by the  symbol in the code before the next operation to be executed.
| Icon | Shortcut | Description | |
|---|---|---|---|
| <Ctrl> + < Shift> + <F5> | Command: ContinueProgram execution is continued until the next set breakpoint is reached. | |
| <F11> | Command: Step into the codeProgram execution is continued at the next line or object and is then halted at this code position. If a user FB call is reached, the POU code is opened in debug mode and stepped through. (This behavior applies to user FBs included in the current project as well as in referenced user libraries.) |
|
| <Ctrl> + <F11> | Command: Step over the codeProgram execution is continued at the next line or object and is then halted at this code position. If a user FB call is reached, the call is stepped over and the next line or object is marked. |
|
| <Shift> + <F11> | Command: Step out of the codeThis command is relevant while stepping through the code of a user FB POU. It exits the FB code and returns to the calling POU. | |
 | <Ctrl> + <Alt> + <F3> | A hot start is not supported by all controller types.Executes a hot start on the controller. During a hot start no data are initialized. Instead, the program is continued with the current variable values.After executing the command, PLCnext Engineer automatically attaches to the running project on the controller and switches to debug mode.The command is only available if PLCnext Engineer is connected to the controller and the controller is stopped. It is not necessary to switch to debug mode.
|
|
 | <Ctrl> + <Alt> + <F4> | A warm start is not supported by all controller types.Executes a warm start on the controller. During a warm start, only non-retentive data are initialized.After executing the command, PLCnext Engineer automatically attaches to the running project on the controller and switches to debug mode.The command is only available if PLCnext Engineer is connected to the controller and the controller is stopped. It is not necessary to switch to debug mode.
|
|
 | <Ctrl> + <Alt> + <F5> | Executes a cold start on the controller. During a cold start all data are initialized.After executing the command, PLCnext Engineer automatically attaches to the running project on the controller and switches to debug mode.The command is only available if PLCnext Engineer is connected to the controller and the controller is stopped. It is not necessary to switch to debug mode. |
Removing breakpoints
Removing breakpoints is possible in the code or in the BREAKPOINTS window.
- Code: to remove a single breakpoint, left-click the respective object or code line and select the 'Toggle Breakpoint' command:
- BREAKPOINTS window: to remove one or more individual breakpoints select the respective lines in the BREAKPOINTS window (multiselection as usual) and select the 'Remove Breakpoint' command from the context menu or toolbar:
- BREAKPOINTS window: to remove all breakpoints, select the 'Remove All Breakpoints' command from the context menu or toolbar:
Afterwards continue the application by clicking the 'Continue' button in the CALL STACKS or BREAKPOINTS window: