LOGIC ANALYZER Window
The LOGIC ANALYZER window, located in the Cross Function Area at the lower screen border, provides a recording tool for subscribing online variable values from the controller and displaying them as graphic curve.
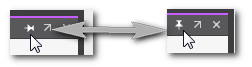
 | You can hide/show the window by clicking the button shown left on the Cross Function Area toolbar. For closing the window, you can also click the cross icon on the right of the window title bar: 
 How to pin/unpin the window in the Cross Function Area How to pin/unpin the window in the Cross Function Area  How to undock/dock the window
  / /
|
 | If the debug mode is active and one of the following conditions is met while the LOGIC ANALYZER window is closed, the icon on the Cross Function Area toolbar is shown with an envelope icon.
|

Closing the window if a list of subscribed variables is inserted does not delete the subscription list.
| Further Info
For detailed information about the window and how to work with it, see the topic "LOGIC ANALYZER: Monitoring the application". |
| Note
The LOGIC ANALYZER window is not available for the safety-related application. |
Toolbar
| Toolbar button | Description | ||
|---|---|---|---|
 | Shows or hides the subscription list (legend) and, if available, the distance measurements made for a recorded value/port.
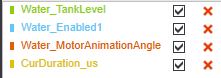 Functions in the subscription list/legend:
|
||
 | Moves the variable selected in the subscription list up- or downwards. Only one variable can be selected and moved at the same time. | ||
 | Starts a manual recording session: recording of the variables/ports added to the subscription list is started immediately. No trigger conditions have to be defined. Recorded variables values are continuously loaded into the LOGIC ANALYZER window and visualized there. Recording is continued until manually stopped with the toolbar button: |
||
 | Starts a triggered recording session: recording of the variables added to the subscription list is only started if the conditions defined as trigger event in the 'Trigger Condition' dialog box are met. At the time the trigger event occurs, subscribed data recorded before the trigger event is loaded into the LOGIC ANALYZER window and visualized there. Then, the recording is continued continuously. The triggered session is automatically finished when the defined number of cycles after the trigger event is reached. While recording, the session can be stopped at any time by clicking the toolbar button .Both settings the number of recording cycles before and after the trigger event have to be defined by clicking the following icon: |
||
| Terminates the active recording session (manual or triggered). After stopping the subscription, the recorded value curves remain visible. | ||
 | Defines the task with which the value recording is synchronized. The values are subscribed at the end of the selected task.
|
||
| Opens the 'Trigger Conditions' and 'Recording Settings' where you have to define the trigger event and the number of cycles to be recorded before and after the trigger event.
|
||
| Clears all curves from the display. Recorded data are lost after clearing the curves. | |||
 | Exports the recorded values to a csv file, for example, for processing the exported data with another
tool.The csv file has the format Timestamp;VAR1;...;VARn. Variables/ports are listed including their instance path. |
||
 | Imports recorded data from a previously exported csv file and displays them as curves. | ||
 | Adapts the time axis of all displayed curves: either the curves are shown completely since the beginning of the recording, or only the last minute of the session is visible. | ||
 | Pauses the update of the displayed curves. The curves are "frozen" which facilitates the closer examination of a particular point of time. While paused, the subscription is continued. After resuming the update by clicking the button again, the curves are updated with the data recorded while pausing and the recording/updating is continued. |
||

 | Displays a popup with
|
||
 | Allows the manual scaling and panning of each value axis.
|
||
 | Displays a stacked view of all curves, each in its own graph. | ||
 | Displays all curves in one graph. The zoom factor of each y-axis is set suitable to fit into the graph. | ||
 | Displays the time values on the time-axis (time-axis label) as absolute time values (timestamp from the controller is used).
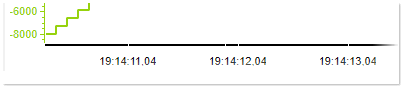 |
||
 | Displays the time values on the time-axis (time-axis label) as relative time values, i.e., relative to the start of recording.
 |
||
 | Displays the time values on the time-axis (time-axis label) as number of samples collected from the start of recording.
 |

