| Selection of network interface or simulation (drop-down list, leftmost) | - | Allows the selection of the network interface or simulation to which the Cockpit commands relate.Example: The AXC F 1152 controller provides a controller simulation. In the drop-down list, you can set the controller ('TCP/IP') or the controller 'Simulation' as target system. |
| Port | - | Allows to set the port used for the communication with the controller or simulation. Port 41100 is set by default. |
 | - | Establishes/disconnects a communication connection between PLCnext Engineer and the controller. Note that the target is selected via the drop-down list described in the previous table row.
 Logon to the controller required
As the controller involved implements a secure device concept, you have to be logged on to the controller using a valid user name and password to get write access to the controller. If you are not logged on when connecting, the authentication dialog appears.
If an authentication error occurs during connection establishment (due to a rejected or unknown controller certificate), a dialog appears where you can instruct PLCnext Engineer to establish the ("unsecure") connection nevertheless.
While you are logged on to the controller, this is indicated by a green shield symbol  beside the controller icon in the PLANT. If you have accepted an "unsecure" connection, the following shield symbol is displayed: beside the controller icon in the PLANT. If you have accepted an "unsecure" connection, the following shield symbol is displayed: 
Refer to the topic "Network Security" for details. User roles can be added and modified via the Web-Based Management (WBM) of the controller.
While connected, the controller icon in the PLANT indicates the controller status.
Examples for controller status icons
The following operations are possible when connected to the controller:
- Write and start the project.
- Control, i.e., start, stop, reset the application with the buttons described in this table.
- Display and update diagnostic controller information in the Cockpit.
To transfer online values from or debug commands to the controller, the debug mode must additionally be activated using the 'Debug On/Off' command (see next table line).When selecting the command 'Connect/Disconnect' from the controller context menu in the PLANT or on the Cockpit toolbar (see icon below) while debug mode is active, PLCnext Engineer detaches from the running application process (programming mode becomes active) and then disconnects from the controller. |
 | - | Activates the debug mode by attaching PLCnext Engineer to the running application process on the controller.This command is only available, if a communication connection exists between PLCnext Engineer and the controller (see previous table line).In debug mode, the controller icon in the PLANT indicates the controller status.
Examples for controller state icons
While debug mode is active (PLCnext Engineer is attached):
- the controller icon in the PLANT indicates the controller status (see first table line),
- online values of variables are read from the controller and can be displayed in ,
-
,
-
can be used for monitoring,
- the LOGIC ANALYZER can be used for recording variables values read from the controller.
Furthermore, the Name of Station of the controller is shown in bold letters. |
 | - | As the controller implements a secure device concept, the 'Logon/Logoff' command is available as Cockpit button and in the context menu of the controller icon.While you are logged off, the command opens the authentication dialog where you have to enter a user name and password for the desired user role. Logging on to the controller automatically establishes a communication connection to the controller.If you are logged on, the command logs you off from the controller and terminates the communication connection to the controller ('Disconnect').Refer to the topic "Network Security" for details. User roles can be added and modified via the Web-Based Management (WBM) of the controller. |
 | - | As the controller implements a secure device concept, the 'Switch User' command is available as Cockpit button and in the context menu of the controller icon.Switch the user role: the command logs off from the controller in order to log on with a different user name (role). The command is only available, while you are logged on to the controller.
Logon information
Whether you are logged on to the controller is indicated by a green shield symbol beside the controller icon in the PLANT. When hovering the mouse on the controller icon, a tooltip appears showing logon information.
Refer to the topic "Network Security" for details. User roles can be added and modified via the Web-Based Management (WBM) of the controller. |
 | - | As the controller implements a secure device concept, the 'Change Password' command is available as Cockpit button and in the context menu of the controller icon.Opens a dialog where you can change the password of the user currently logged on at the controller. The command is only available, while you are logged on to the controller
Logon information
Whether you are logged on to the controller is indicated by a green shield symbol beside the controller icon in the PLANT. When hovering the mouse on the controller icon, a tooltip appears showing logon information.
Refer to the topic "Network Security" for details. |
 | - | For those controllers that support several 'Write' commands, these commands may be organized in a drop-down button list shown left. The command executed last remains visible in the toolbar.
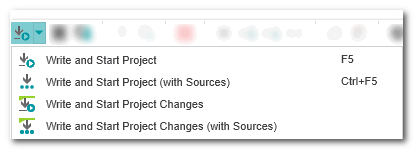 The available commands are described in the following table rows.
Note
You can configure which 'Write and Start' commands are available in the list of the drop-down button and which command is the default command. Select 'Extras > Options' and open the 'Online | Write and Start commands' category. To make a command visible in the drop-down list, check the corresponding checkbox. |
|
 | <F5> | "All in one" command 'Write and Start Project'. The following is executed:The application is ready for .The command is only available if PLCnext Engineer is connected to the controller. It is not necessary to switch to debug mode.
Note
If project sources are stored on the controller, they will be deleted by this command. To include the project sources and store them on the controller, use the command 'Write and Start Project (with Sources)' (see next line). |
|
 | <Ctrl> + <F5> | "All in one" command 'Write and Start Project (with Sources)'. The command includes the same operations as the 'Write and Start Project' command described in the preceding table row. Additionally, it includes the project sources (packed as archive file) and stores them on the controller.Project sources stored on the controller can be read and loaded into PLCnext Engineer with the 'Read Sources' command (if supported by the controller - see below).The command is only available if PLCnext Engineer is connected to the controller and the controller is stopped. It is not necessary to switch to debug mode.This feature may not be available for all controller types. |
 | - | This feature may not be available for all controller types."All in one" command 'Write and Start Project Changes': after modifying the project, it is rebuild and automatically written to the running controller. The controller then switches from the old to the new project version without stopping or a reset.
Therefore, the list of executed operations corresponds to the list under the 'Write and Start Project' command, except the controller reset and restart.
Note
Executing this command may result in realtime violations in the application. |
The command is not available if the modifications you made in the project prevent an the 'Write changes' command and if the controller runs in debug mode.Refer to the topic "Writing Project Changes to the Controller" for details. |
 | - | This feature may not be available for all controller types."All in one" command 'Write and Start Project Changes (with Sources)'.The command includes the same operations as the 'Write and Start Project Changes' command described in the preceding table row. Additionally, it includes the project sources (packed as archive file) and stores them on the controller.The command is only available if PLCnext Engineer is connected to the controller and the controller is stopped. It is not necessary to switch to debug mode. |
 | - | "All in one" command 'Write and Start Project (incl. Safety)'.
The command executes 'Write and Start' for both the standard controller and the Safety PLC. You must be logged on to both devices. Otherwise, you are prompted to logon (first to the standard controller then to the Safety PLC).This command is only available if a Safety PLC is included in your project which supports the combined writing. |
 | - | "All in one" command 'Write and Start Project (incl. Safety with Sources)'.
The command includes the same operations as the 'Write and Start Project (incl. Safety)' command described in the preceding table row. Additionally, it includes the project sources (packed as archive file) and stores them on the controller.Project sources stored on the controller can be read and loaded into PLCnext Engineer with the 'Read Sources' command (if supported by the controller - see below).The command is only available if PLCnext Engineer is connected to the controller and the controller is stopped. It is not necessary to switch to debug mode.This feature may not be available for all controller types. |
 | - | Updates the displayed diagnostic information in the Cockpit.The command is only available if PLCnext Engineer is connected to the controller. It is not necessary to switch to debug mode.
|
 | - | Launches the default web browser that is configured for your computer and executes the visualization (HMI application). The display starts with the HMI page specified as start page.The HMI application can be run using the integrated web server of the controller.The command is only available if the PC running PLCnext Engineer and the controller are physically connected to the network and the controller is reachable in the network.Refer to the topic "Running the HMI Application" for further details. |
 | - | Access to network device via the default web browser that is configured for your computer.PLCnext Engineer allows you to access the web-based management (WBM) interface of a device directly from the Cockpit. The web-based management interface can be used to manage and configure the device from
anywhere in the network using a standard browser.
Note
WBM can only be called for a device which has a valid IP address assigned and which supports the web-based management. |
Further Info
For detailed information on the web-based management and the provided configuration and diagnostic functions, see the user manual of the device. In addition, the help topic "Security Settings of the Controller (via WBM)" provides information. |
|
 Switch redundancy role
 | - | The button is only available forPLCnext Technology controllers with redundancy function. In addition, both controllers must be reachable and in SYNC (work synchronously) or HSBY (Hot Standby) state.Performs a switch-over of the redundancy role of the controllers, i.e., the PRIMARY controller becomes the BACKUP controller and vice versa.
|
 | - | This feature may not be available for all controller types.Loads the project sources stored on the controller into PLCnext Engineer.The command is only available if PLCnext Engineer is connected to the controller and if project sources have been written before using the command 'Write and Start Project (with Sources)' (see table row above). It is not necessary to switch to debug mode.Refer to the topic "Reading project sources from the controller". |
 | - | This feature may not be available for all controller types.Sets the real-time clock on the controller to the current system time of the computer.The command is only available if PLCnext Engineer is connected to the controller. It is not necessary to switch to debug mode. |
 | - | This feature may not be available for all controller types.If pressed, the controller switches from the Run state to the Halt state if a string error has been detected. |
 | <Ctrl> + <Alt> + <F2> | Stops the program execution on the controller.The command is only available if PLCnext Engineer is connected to the controller and the controller is running. It is not necessary to switch to debug mode. If debug mode is active, the controller status changes from "Running" to "Stopped" (indicated by the controller icon in the PLANT). |
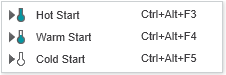
 | - | For those controllers that support retain handling, several possibilities for restarting the controller are available. According to the IEC 61131 standard, the following restarts are provided:
- Hot start does not initialize any variables. Instead, the stored retain values are used.
- Warm start initializes only non-retentive variables
- Cold start initializes all variables
The commands are organized in a drop-down button list shown left. The command executed last remains visible in the toolbar.
 The available commands are described in the following table rows.
 |
 | <Ctrl> + <Alt> + <F3> | A hot start is not supported by all controller types.Executes a hot start on the controller. During a hot start no data are initialized. Instead, the program is continued with the current variable values.After executing the command, PLCnext Engineer automatically attaches to the running project on the controller and switches to debug mode.The command is only available if PLCnext Engineer is connected to the controller and the controller is stopped. It is not necessary to switch to debug mode.
|
 | <Ctrl> + <Alt> + <F4> | A warm start is not supported by all controller types.Executes a warm start on the controller. During a warm start, only non-retentive data are initialized.After executing the command, PLCnext Engineer automatically attaches to the running project on the controller and switches to debug mode.The command is only available if PLCnext Engineer is connected to the controller and the controller is stopped. It is not necessary to switch to debug mode.
|
 | <Ctrl> + <Alt> + <F5> | Executes a cold start on the controller. During a cold start all data are initialized.After executing the command, PLCnext Engineer automatically attaches to the running project on the controller and switches to debug mode.The command is only available if PLCnext Engineer is connected to the controller and the controller is stopped. It is not necessary to switch to debug mode. |
 | - | Saves the retain data to a backup file. This way, you can "preserve" a particular condition of your application at a desired point in time. You can reload these values later (see next table row).By copying the backup file to an SD card, retain values can, for example, be reused after a controller replacement or transferred to different controllers/applications.This command is available while the controller is connected to PLCnext Engineer and you are logged on to the controller. The command can be executed independently of the controller state.
Note
Make sure that no retain data is changed in the project while the backup is stored. This can, for example, be ensured by setting the controller to Stop state before clicking the button. |
Clicking the button writes the values of all retentive variables to a file (*.prb). The name of the backup file is composed of the current date and time as well as the name of the user who is currently logged on. Up to 10 backup files are possible. Each further backup overwrites the oldest file.Refer to the topic "Extended Retain Handling" for further information. |
 | - | Restores the latest retain data from a backup file (*.prb). This way, you can reload a particular condition of your application you have saved before (see previous table row).The command is only available while the controller is connected to PLCnext Engineer and in Stop state, and you are logged on to the controller.Clicking the button preloads the last saved retain values from the backup file and then executes an extended warm start.
Note
Restoring backed up retain data this way is only possible if the project name and the Retain CRC are the same. |
Refer to the topic "Extended Retain Handling" for further information. |
 | <Ctrl> + <Alt> + <F6> | Reboots the controller. The operation corresponds to a Power Off/On operation. The loaded application (code and network configuration) is deleted from the RAM. The controller reboots with the settings stored last and loads the boot project stored in the Flash Memory, if available. The command is only available if PLCnext Engineer is connected to the controller and the controller is stopped. It is not necessary to switch to debug mode. |
 | - | Resets the controller to factory defaults. Similar to the 'Reboot' command, the loaded application (code and network configuration) is deleted from the RAM and Flash Memory (Boot Project). Additionally, all communication settings are reset to default settings. After executing the command, the controller has its original configuration state as when unboxing it.The command is only available if PLCnext Engineer is connected to the controller and the controller is stopped. It is not necessary to switch to debug mode. |
 | - | Enables the use of breakpoints on the connected controller. Set breakpoints are only activated (i.e., the controller only halts at a breakpoint), if the use of breakpoints is enabled (button is pressed). Otherwise, none of the defined breakpoints can become activated, regardless of the commands you execute in online code worksheets or the BREAKPOINTS window.Refer to the topic "Debugging code: Breakpoints" for details. |


 | - | Three buttons at the right side of the toolbar that provide options for extended debugging.Activating one of the buttons opens the 'Debug Code Settings' dialog (see also below). In the dialog, you can select the items you want to debug.
- If no button is pressed, the extended debug features are deactivated. "Normal" debugging in program and FB instances is possible.
-
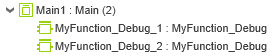
'Debug Functions': Activating this option allows debugging of functions, methods, inline transitions and actions. For that purpose, additional code is generated and executed which then supports debug functions for the mentioned POU parts. Even forcing/overwriting and the use of breakpoints is possible while the option is activated.In the PLANT, each call of a function is visible as separate instance node (named 'functionname_Debug') under the respective program or FB instance node. Example:
-
'Execution Value': In this mode, the actual variable value at the code position at the time of processing is displayed in the online worksheet instead of "normal" online values which are read from the I/O image between controller working cycles.
This mode is automatically activated, when clicking the next button 'Execution Value and Execution Indication'.
-
'Execution Value and Execution Indication': In addition to the display of execution values, special execution indication signs show whether the code position is currently executed.
- 'Debug FUs' and 'Execution Values' can be combined. In this case, execution values are even displayed in online worksheets of user functions.
See topics "Extended Debugging: Functions, Methods, and SFC Actions/Transition" and "Extended debugging: Execution values" for details.
Note
If activated, each of these options increases the execution time and memory consumption on the controller. Deactivate the option for normal operation, i.e., after debugging. |
|
 Debug code settings
 | - | This command is only active, if one of the debug options (buttons) described in the previous table row is activated.
The button opens a dialog where you can modify the selection of the items (POUs) you want to debug.
Note
In order to keep the processor load and memory consumption as low as possible, mark only those POUs that are really required. |
|


